Overall numbers, including Domicile
This page presents information on Oxford’s overall application numbers, as well as the domicile of Oxford’s applicants, offer holders and admitted students.
Overall numbers
A student’s domicile refers to their country of permanent residence, as provided on their UCAS application. This is not necessarily their nationality, but it is the country where they usually live. For example, ‘UK-domiciled students’ includes students with non-British nationality who are permanently resident in the UK (not just here for the purposes of education). It does not include UK students who live permanently outside the UK.
- The number of students admitted in 2024 was 3,245, in line with pre-pandemic levels.
Overall applications to Oxford, offers made and students admitted, all domiciles, 2020–2024
| Year | Applications | Offers | Students admitted |
|---|---|---|---|
| 2024 | 23,061 | 3,793 | 3,245 |
| 2023 | 23,211 | 3,721 | 3,219 |
| 2022 | 23,819 | 3,645 | 3,271 |
| 2021 | 24,338 | 3,555 | 3,298 |
| 2020 | 23,414 | 3,932 | 3,695 |
Courses with the highest number of applicants per place (all domiciles, three-year total 2022–2024)
| Course | Number of applicants per place |
|---|---|
| Economics & Management | 19.1 |
| Computer Science | 17.2 |
| Maths & Computer Science | 11.9 |
| Biomedical Sciences | 11.7 |
| Medicine | 11.1 |
| Mathematics | 10.5 |
| Law* | 10 |
| Physics | 8.6 |
| History & Politics | 8.6 |
| Chemistry | 8.5 |
*Including Law/Law with Studies in Europe
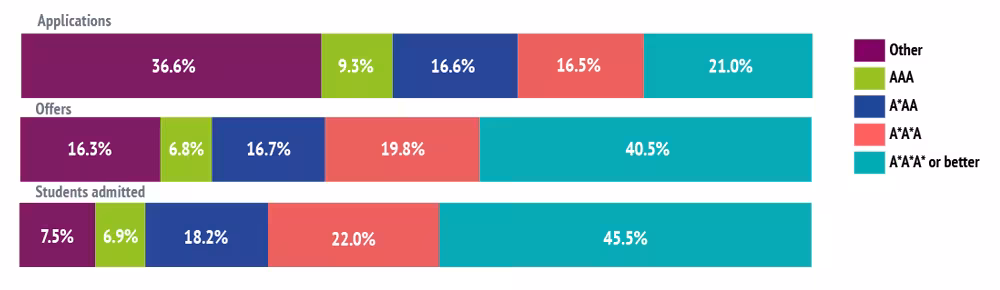
A-level grade profile of UK-domiciled students applying to, receiving offers from and being admitted to Oxford (2024 UK intake)
(A-level bands include results from the 2023 and 2024 examination rounds. Excludes General Studies and Critical Thinking, and candidates with fewer than three A-level results.)
- While three A grades is Oxford’s minimum standard offer for candidates taking A-levels, many courses – particularly in the sciences – require at least one A* grade.
- 54.1% of applicants and 85.6% of admitted students were awarded A*AA or better at A-level.
- 45.5% of admitted students achieved three A* grades or better at A-level
Breakdown by Domicile
- Since 2020, applications from UK students and non-EU students have risen, and applications from EU students have fallen.
- UK-domiciled applicants are substantially more likely to receive an offer of a place to study at Oxford than students from outside the UK.
- Since 2020, the proportion of students admitted who are from the UK has risen to 80.5% from 79.8%, whilst the proportion from non-EU countries has increased to 16.3% from 13.0%.
- The proportion of students who applied from the EU fell to 6.5% in 2024 from 11.7% in 2020.
- Oxford does not operate quotas or targets around the nationality or domicile of students admitted to the University. The exception is Medicine, which is subject to a government restriction on the number of students with international fee status who can be admitted each year.
- The country of domicile of the largest number of overseas applications and admitted students was the People’s Republic of China.
Overall applications to Oxford, offers made and students admitted by area of domicile, 2020–2024
UK Students
| Year | Applications | Offers | Students admitted | Proportion of total applicants | Proportion of total students admitted |
|---|---|---|---|---|---|
| 2024 | 14,694 | 2,996 | 2,612 | 63.7% | 80.5% |
| 2023 | 14,636 | 2,905 | 2,560 | 63.1% | 79.5% |
| 2022 | 14,569 | 2,806 | 2,596 | 61.2% | 79.4% |
| 2021 | 14,401 | 2,781 | 2,691 | 59.2% | 81.6% |
| 2020 | 14,102 | 3,059 | 2,950 | 60.2% | 79.8% |
EU Students
| Year | Applications | Offers | Students admitted | Proportion of total applicants | Proportion of total students admitted |
|---|---|---|---|---|---|
| 2024 | 1,492 | 125 | 103 | 6.5% | 3.2% |
| 2023 | 7,003 | 150 | 119 | 6.8% | 3.7% |
| 2022 | 7,463 | 163 | 124 | 7.5% | 3.8% |
| 2021 | 7,801 | 166 | 128 | 8.8% | 3.9% |
| 2020 | 6,567 | 292 | 266 | 11.7% | 7.2% |
Non-EU Students
| Year | Applications | Offers | Students admitted | Proportion of total applicants | Proportion of total students admitted |
|---|---|---|---|---|---|
| 2024 | 6,875 | 672 | 530 | 29.8% | 16.3% |
| 2023 | 7,003 | 666 | 540 | 30.2% | 16.8% |
| 2022 | 7,463 | 676 | 551 | 31.3% | 16.8% |
| 2021 | 7,801 | 608 | 479 | 32.1% | 14.5% |
| 2020 | 6,567 | 581 | 479 | 28.0% | 13.0% |
Countries with the highest number of applications and students admitted to Oxford, three-year total 2022–2024
Applications
| Country/Region of domicile | Applications |
|---|---|
| UK | 43,899 |
| China | 6,372 |
| United States of America | 2,629 |
| India | 1,757 |
| Singapore | 1,754 |
| Hong Kong | 1,257 |
| Canada | 848 |
| Germany | 762 |
| Malaysia | 679 |
| France | 591 |
| Spain | 517 |
Students admitted
| Country/Region of domicile | Students admitted |
|---|---|
| UK | 7,768 |
| China | 566 |
| Singapore | 257 |
| United States of America | 172 |
| Hong Kong | 148 |
| India | 74 |
| Australia | 58 |
| France | 51 |
| Germany | 48 |
| Canada | 36 |
| Turkey | 33 |
Context
UK universities by domicile of students
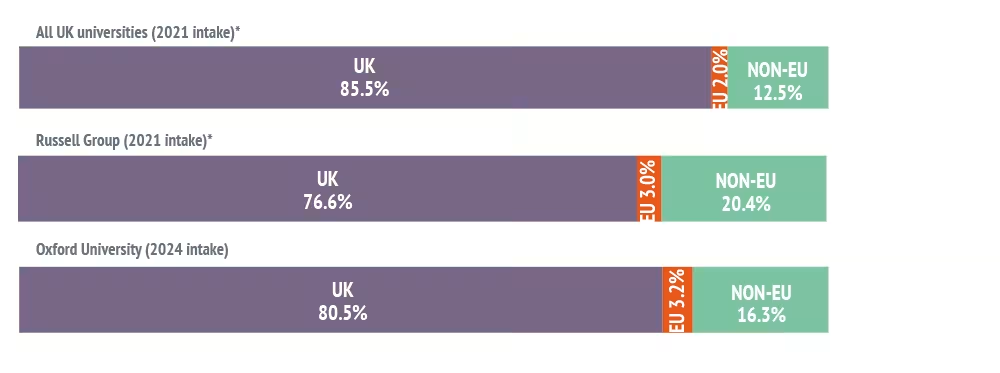
*Most recent available national data covers 2021 intake: defined as first-year, first-degree, undergraduate students, academic year 2021/22. Excludes those of unknown domicile. See note on HESA data for full citation.
For further information on all Oxford's admissions statistics, including by course and by college, please read the Annual Admissions Statistical Report.
You may also be interested to see detailed statistics relating to nationality and domicile and information on the qualifications of our applicants.