Disability
This page sets out the number and proportion of UK-domiciled students who declare a disability on application to Oxford.
- The number of students declaring a disability on application, the number of those students receiving offers and the number being admitted, has been increasing year on year since 2020.
- In 2024, 19.0% of admitted students had declared a disability on application, 8.6 percentage points higher than in 2020.
UK-domiciled students declaring a disability, 2020–2024
| Year | Disability | No known disability | Proportion of total UK students admitted | ||||
|---|---|---|---|---|---|---|---|
| Applications | Offers | Admitted | Applications | Offers | Admitted | ||
| 2024 | 2,817 | 604 | 495 | 11,877 | 2,392 | 2,117 | 19.0% |
| 2023 | 2,727 | 581 | 487 | 11,909 | 2,324 | 2,073 | 19.0% |
| 2022 | 1,833 | 374 | 333 | 12,736 | 2,432 | 2,263 | 12.8% |
| 2021 | 1,595 | 326 | 311 | 12,806 | 2,455 | 2,380 | 11.6% |
| 2020 | 1,519 | 325 | 307 | 12,583 | 2,734 | 2,643 | 10.4% |
UK-domiciled students declaring a disability by category of disability, three-year total 2022–2024
Applications | Offers | Students admitted | Proportion of total UK students admitted | |
|---|---|---|---|---|
| Autistic spectrum disorder | 855 | 203 | 168 | 2.2% |
| Blind/partial sight | 132 | 27 | 25 | 0.3% |
| Deaf/partial hearing | 155 | 34 | 30 | 0.4% |
| Learning difficulty* | 1,663 | 313 | 268 | 3.5% |
| Longstanding illness | 816 | 177 | 149 | 1.9% |
| Mental health | 2151 | 454 | 379 | 4.9% |
| Multiple disabilities | 893 | 203 | 166 | 2.1% |
| Other disability | 542 | 110 | 97 | 1.2% |
| Wheelchair/mobility | 170 | 38 | 33 | 0.4% |
| Total with declared disability | 7,377 | 1,559 | 1,315 | 16.9% |
| No declared disability | 36,522 | 7,148 | 6,453 | 83.1% |
| Total | 43,899 | 8,707 | 7,768 | 100.0% |
* including dyslexia, dyspraxia and ADHD
Context
Breakdown of students at UK universities by disability status
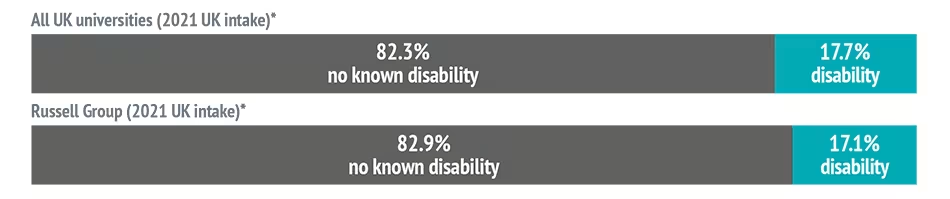
Oxford University (2024 UK intake)

*Most recent available national data covers 2021 intake: defined as first-year, first-degree, UK-domiciled undergraduate students, academic year 2021/22. AAA+ pool includes equivalent Scottish qualifications. See note on HESA data for full citation.
For further information on all Oxford's admissions statistics, including by course and by college, please read the Annual Admissions Statistical Report.
You may also be interested to see detailed statistics relating to disability.