How is my town doing? A local view of COVID-19 reproduction rates
COVID-19 has asked a lot of everyone. At the national level, decisions have been taken that affect everything from people’s movements to the running of businesses. For many, there are also individual decisions in which personal risks are weighed: Should I venture to my local grocery store, or should I shop online? Can I eat at the restaurant, or should I buy take out?
In many households, dinner time musings often drifted to something like the following: 'I have barely seen anyone in person for many weeks. I know my neighbours haven’t either. My favourite park is much emptier than usual and the community around me has made many sacrifices. Does this mean COVID-19 is actually decreasing in my area?'
While most people have a UK-wide view and newspapers report national statistics, the decisions that people make to help contain the pandemic are at an individual and personal level. The behaviour of people in Oxford has no sizable effect on COVID-19’s growth or decline in far away Scotland, and these decisions need real-time, local information, an up to date resource that anyone can access to see how their town or county is doing.
View Local Covid UK Map here: https://localcovid.info/
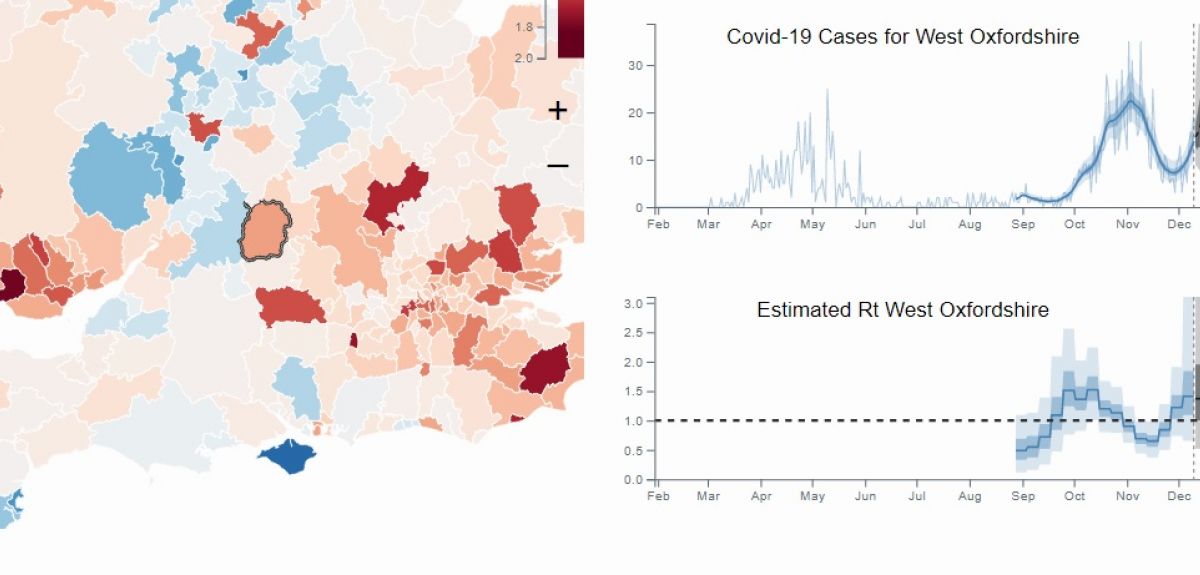
Using historical COVID-19 case counts, the map at localcovid.info shows an estimate for the R number in each local area, along with projections of how the epidemic might develop in the next two weeks
The reproduction number or “R number” tells us about the growth and decline of COVID-19. It is an estimate of the number of people that someone with COVID-19 will pass the virus on to. A reproduction number of R=2 means that an infected person is likely to transmit the virus on to two other people, each of whom then passes it to two more people, and the epidemic grows quickly. On the other hand, if R=1, then on average each infected person only infects one other person and the size of the epidemic remains roughly constant. A reproduction number of R<1 is good news: the number of new infections is reducing and over time the epidemic will shrink.
Yee Whye Teh, Professor of Statistical Machine Learning at the Department of Statistics, University of Oxford, explains how the national “R number” is made up of many local parts: 'The national R number describes an average transmission rate across the nation. It is an aggregate statistic made up of many smaller contributions, and belies significant variations in COVID-19 transmissions rates, both geographically as well as across different sections of society. In order to inform individual decisions, local information relevant to the individual is needed.'
Led by Professor Teh, a team from the Computational Statistics and Machine Learning research group at Oxford’s Department of Statistics has built a model that monitors the daily spread of the virus locally. Their results can be accessed online by anyone at localcovid.info, which gives an informative view of the rate of transmission of COVID-19 in areas such as Oxford, Cherwell, West Oxfordshire, Swindon and more than 300 other local authorities in the UK.
Using historical COVID-19 case counts, the map at localcovid.info shows an estimate for the R number in each local area, along with projections of how the epidemic might develop in the next two weeks. The estimates of R in the map contain what statisticians call “error bars” or “credible intervals”. These are there to say that no one knows the true R number in an area, but we are quite sure that we can pin it down to within a narrow band. For example, in the map snapshot December 14, we are 95% sure that R is currently between 0.7 and 1.4 in Oxford, with a median of 1.0, given the team’s statistical model and the data available.
The real work dynamics of epidemics are incredibly complicated.
Michael Hutchinson, a PhD student in professor Teh’s group, explains how the “R number” is estimated from data: 'This is a difficult task. The real work dynamics of epidemics are incredibly complicated. To begin estimating the R number we start by proposing a simplified statistical model of the real world which captures the most important aspects of the epidemic. We never observe the R number directly, we only observe positive COVID-19 cases. We know that the R number drives new infections however, so using the model and observations of numbers of cases we can infer what R is likely to be. Essentially, using what we see in the world, we reverse engineer what the unobservable R is.'
The statistical model underlying these estimates of R relies on publicly available Pillar 1+2 daily counts of positive PCR swab tests by specimen date, for 312 lower-tier local authorities in England, the 14 NHS Health Boards in Scotland and the 22 unitary local authorities in Wales. The model makes additional use of commuter flow data from the UK 2011 Census and population estimates, as COVID-19 spreads not just among the population of individual areas, but also across areas. As with many aspects of statistical epidemiology, these estimates of R need to be read with care, and in the context of other pieces of data that provide relevant information, e.g. data from the ZOE symptom tracker, seroprevalence studies, test positivity rates, as well as hospitalisation and death rates.
Dr. Ulrich Paquet, a research scientist seconded to the group, noted: 'We are pleasantly surprised to see how the estimates for R have dropped below one for a while in many areas, especially in the North where Tier 3 rules applied since October. We guess that we shouldn’t be surprised to see the result of public behaviour and national action show up so clearly in a model, but we still are! As statisticians, we love it when the data speaks for itself.'
Prof. Teh concluded on a more sombre note: 'We are concerned that since the lockdown was lifted in December, many areas, particularly in the Southeast and London, have seen cases continue to increase. We hope the tool we built at localcovid.info will be helpful to you, in making your decisions to stay safe and to help protect your loved ones.'
Track your local area on the Local Covid UK Map here: https://localcovid.info/.
About OxSciBlog
The Oxford Science Blog gives you the inside track on science at Oxford University: the projects, the people, and what's happening behind the scenes. Curated by Ruth Abrahams, Media Relations Manager (Research and Innovation).
Contact: Ruth Abrahams, ruth.abrahams@admin.ox.ac.uk