
Finance and funding
The key financial objectives of the University are to provide the long-term resources to strengthen and further its pre-eminent position – nationally and internationally – as a place of outstanding learning, teaching, and research; and to enable it to provide additional support to its three core priorities of students, academic posts, and buildings.
Download the Financial Statements 2024-25 (PDF). The Financial Review starts on page 40.
Education
| % change year on year | % change year on year | |
13,650 | -1.9% | NEW | - |
12,375 | -0.8% | 25.9% | +0.2% |
1 ACORN categories 5 and 6, IMD quintile 1 or 2 and Free School Meals. | |||
Research
| % change year on year | % change year on year | |
£801.3m | +2.9% | 1st | - |
£142.2m | -3.9% | 7,604 | +1% |
Educational Publishing (undertaken by the Press)
| % change year on year | % change year on year | |
£733.2m | -1.8% | £104.7m | +5.4% |
more than 187 million | up from 180m | 90 | up from 71 last year |
Engagement and Partnership
| % change year on year | % change year on year | |
1,555 | up from 1,321 | 1,654 | +0.7% |
1,054 | 187 | -4.5% |
Financial Measures
| Income | |
| £3,021.2m | 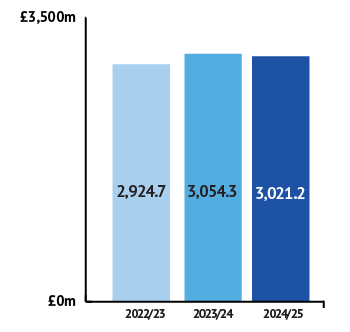 |
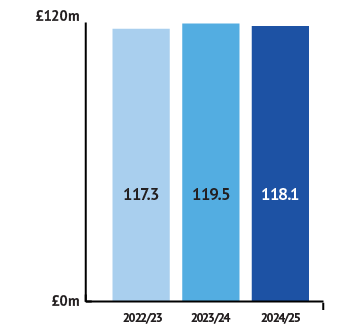
Adjusted surplus before other gains and one-off exceptional items | |
| £118.1m |
|
| Net Assets | |
| £6,903.7m | 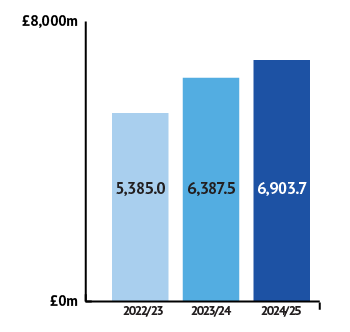 |
| Capital expenditure on property, plant and equipment | |
| £220.8m | 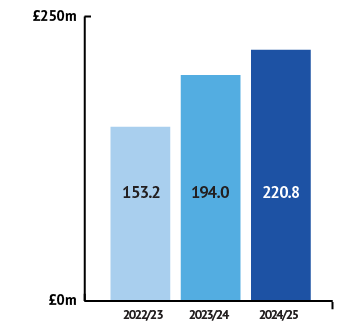 |
Colleges
The colleges of Oxford University (apart from Kellogg, St Cross and Reuben) are financially autonomous. In 2024–25, the aggregate annual incoming resources (including donations for capital projects or endowment) of these 36 colleges amounted to £741.4m. The three main sources of income are teaching, research and residential (40% of the aggregate income), legacies and donations (22%), and investment income (32%).
Other income derives mostly from trading activity such as vacation conferences.
Total resources expended amounted to about £680.1m in 2024/25; 83% of this expenditure was directly attributed to core activities, including teaching, research and residential services. The balance is split between the costs of fundraising, running trading activities such as conferences and tourism, and investment management costs.
Endowments
The University has endowment reserves of £2.1bn. Individual colleges have their own endowment assets, which amount to £7.1 bn.