Gender
This page breaks down Oxford’s group of UK-domiciled applicants, offer holders and admitted students by gender declared on application10.
University-level data
- The female proportion of UK-domiciled undergraduate students admitted to Oxford has risen over the past five admissions cycles.
- In 2018 to 2022, Oxford admitted more UK-domiciled female undergraduates than male.
UK applications to Oxford, offers made and students admitted by gender, 2018–2022
| Female | Male | ||||||
| Applications | Offers | Admitted | Applications | Offers | Admitted | Female proportion of total UK students admitted | |
2022 | 7,383 | 1,495 | 1,379 | 7,186 | 1,311 | 1,217 | 53.1% |
2021 | 7,411 | 1,542 | 1,486 | 6,990 | 1,239 | 1,205 | 55.2% |
2020 | 7,110 | 1,661 | 1,598 | 6,992 | 1,398 | 1,352 | 54.2% |
2019 | 7,145 | 1,678 | 1,407 | 6,736 | 1,381 | 1,183 | 54.3% |
2018 | 6,342 | 1,543 | 1,317 | 6,671 | 1,417 | 1,253 | 51.2% |
Context
Breakdown of students at UK universities by gender (2020 UK intake)*
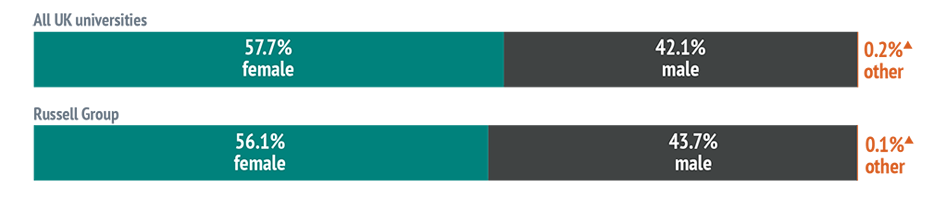
Oxford University (2022 UK intake)

Breakdown of students achieving AAA or better at A-level by gender
(all UK universities, 2020 UK intake)*

*Most recent available national data covers 2020 intake: defined as first-year, first-degree, UK-domiciled undergraduate students, academic year 2020/21. AAA+ pool includes equivalent Scottish qualifications. See note on HESA data for full citation.
▴Other gender: percentages are too small to represent in diagram.
10. The Annual Admissions Statistical Report uses the binary male/female options from the UCAS application, which may not reflect the gender identity of all applicants.
For further information on all Oxford's admissions statistics, including by course and by college, please read the Annual Admissions Statistical Report.
You may also be interested to see detailed statistics relating to gender.