Ethnicity
This page sets out what is known about the ethnicity of UK-domiciled applicants to Oxford. 5% of UK-domiciled applicants (2,148 students between 2020 and 2022) choose not to declare their ethnicity in their UCAS application. It is therefore not possible to make any statements in relation to their ethnicity and admissions status, and for that reason they have not been included in the tables below.
UK-domiciled Black and Minority Ethnic (BME) students include those who indicate in their UCAS application that they identify as Black (including African, Caribbean and other Black background), Asian (including Bangladeshi, Indian, Pakistani, Chinese and other Asian background), Mixed Heritage (including White & Asian, White & Black African, White & Black Caribbean and other Mixed background), Arab or any other ethnicity except White.
Context
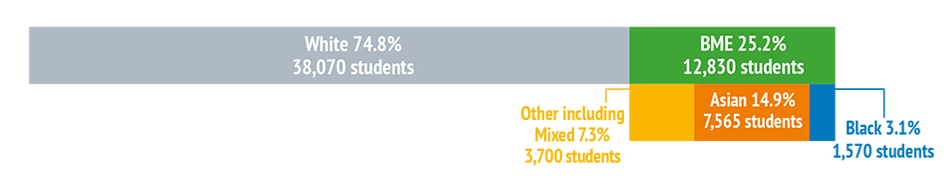
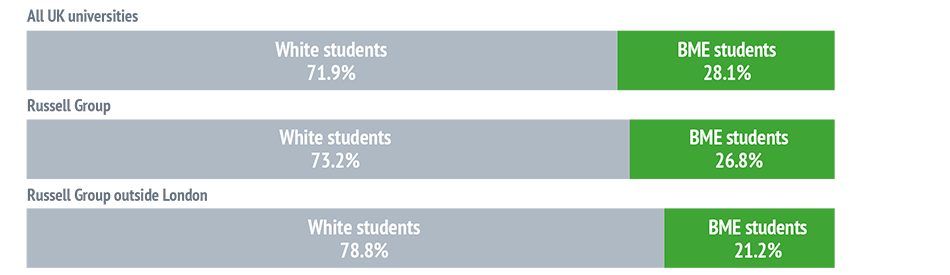
The following graphics provide context for Oxford’s figures, showing the BME share of the England and Wales population, the A-level achievement of BME students, and the proportion of BME students in different parts of the UK university sector.
Note: Figures for the 2020/21 academic year (2020 intake) are the most recent available from HESA and have therefore been used in these graphics. The most recent figures available for Oxford are for the 2022/23 academic year (2022 intake).
England and Wales population now aged 19 to 25*

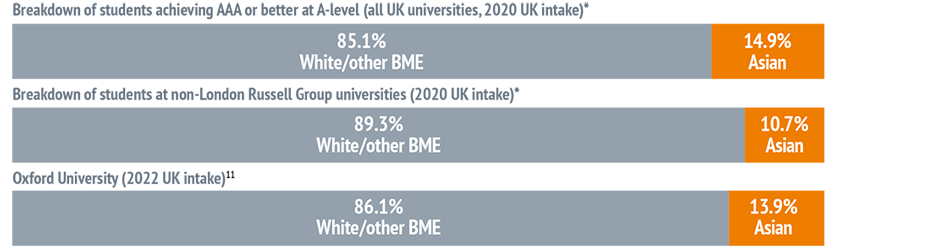
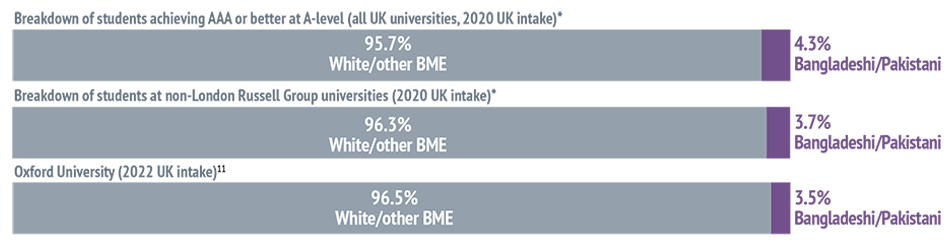
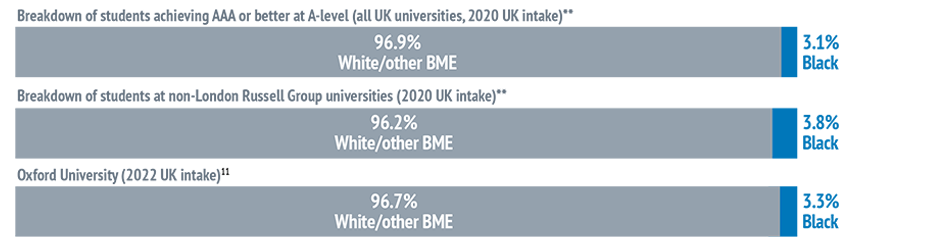
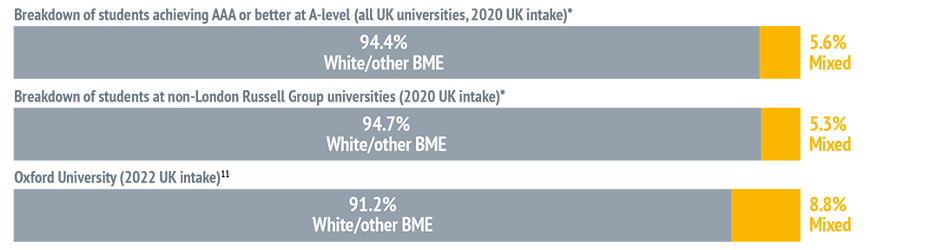
Breakdown of students achieving AAA or better at A-level by ethnicity (all UK universities, 2020 UK intake)**
Breakdown of students at UK universities by ethnicity (2020 UK intake)**
Oxford University (2022 UK intake)***

*2021 UK census. Source: Office for National Statistics. Ethnic group by age and sex in England and Wales.
**Most recent available national data covers 2020 intake: defined as first-year, first-degree, UK-domiciled undergraduate students, academic year 2020/21. AAA+ pool includes equivalent Scottish qualifications. See note on HESA data for full citation.
***Excluding students whose ethnicity status is not declared.
University-level data
BME students
- The number of UK-domiciled BME applicants to Oxford has increased since 2018, as have the numbers of students receiving offers and being admitted.
- The proportion of UK-domiciled students admitted to Oxford who indicate in their UCAS application that they identify as BME has risen from 18.3% in 2018 to 27.8% in 2022.
UK-domiciled BME students: applications to Oxford, offers made and students admitted, 2018–2022
| BME Students | White Students | ||||||
| Applications | Offers | Admitted | Applications | Offers | Admitted | BME proportion of total UK students admitted11 | |
2022 | 4,610 | 773 | 708 | 9,119 | 1,952 | 1,835 | 27.8% |
2021 | 4,254 | 670 | 648 | 9,408 | 2,049 | 1,987 | 24.6% |
2020 | 4,024 | 706 | 684 | 9,509 | 2,293 | 2,214 | 23.6% |
2019 | 3,596 | 669 | 558 | 9,583 | 2,306 | 1,978 | 22.0% |
2018 | 3,097 | 551 | 457 | 9,048 | 2,305 | 2,045 | 18.3% |
11. Excluding students whose ethnicity status is not declared.
Asian students
- Since 2018, applications from UK-domiciled Asian students have been increasing annually, as have offers received and students admitted.
- The proportion of UK-domiciled students admitted to Oxford who indicate in their UCAS application that they identify as Asian has risen from 8.3% in 2018 to 13.9% in 2022.
UK-domiciled Asian students: applications to Oxford, offers made and students admitted, 2018–2022
| Applications | Offers | Admitted | Proportion of total UK students admitted11 | |
2022 | 2,490 | 381 | 354 | 13.9% |
2021 | 2,258 | 308 | 295 | 11.2% |
2020 | 2,135 | 289 | 277 | 9.6% |
2019 | 1,901 | 279 | 243 | 9.6% |
2018 | 1,687 | 249 | 208 | 8.3% |
11. Excluding students whose ethnicity status is not declared.
*Most recent available national data covers 2020 intake: defined as first-year, first-degree, UK-domiciled undergraduate students, academic year 2020/21. AAA+ pool includes equivalent Scottish qualifications. See note on HESA data for full citation.
Bangladeshi and Pakistani students
- Since 2018, the numbers of UK-domiciled Bangladeshi and Pakistani students applying to Oxford, being made offers and being admitted have risen substantially.
- The proportion of UK-domiciled students admitted to Oxford who indicate in their UCAS application that they identify as Bangladeshi or Pakistani has risen from 1.6% in 2018 to 3.5% in 2022.
Note: Within the British Asian group, Bangladeshi and Pakistani students are considered underrepresented at highly selective universities, hence their inclusion as a separate group at University level in this report.
UK-domiciled Bangladeshi and Pakistani students: applications to Oxford, offers made and students admitted, 2018–2022
| Applications | Offers | Admitted | Proportion of total UK students admitted11 | |
2022 | 680 | 98 | 88 | 3.5% |
2021 | 630 | 82 | 75 | 2.8% |
2020 | 618 | 66 | 59 | 2.0% |
2019 | 532 | 67 | 53 | 2.1% |
2018 | 443 | 52 | 41 | 1.6% |
11. Excluding students whose ethnicity status is not declared.
*Most recent available national data covers 2020 intake: defined as first-year, first-degree, UK-domiciled undergraduate students, academic year 2020/21. AAA+ pool includes equivalent Scottish qualifications. See note on HESA data for full citation.
Students with Black African or Black Caribbean heritage12
- The numbers of UK-domiciled students with Black African or Black Caribbean heritage applying to Oxford, receiving offers and being admitted have increased from 2018 to 2022.
- The proportion of UK-domiciled students admitted to Oxford who indicate in their UCAS application that they identify as Black has risen from 2.6% in 2018 to 3.3% in 2022.
UK-domiciled students with Black African or Black Caribbean heritage: applications to Oxford, offers made and students admitted, 2018–2022
| Applications | Offers | Admitted | Proportion of total UK students admitted11 | |
2022 | 618 | 100 | 85 | 3.3% |
2021 | 597 | 95 | 92 | 3.5% |
2020 | 564 | 109 | 106 | 3.7% |
2019 | 498 | 107 | 80 | 3.2% |
2018 | 424 | 86 | 65 | 2.6% |
11. Excluding students whose ethnicity status is not declared.
*Most recent available national data covers 2020 intake: defined as first-year, first-degree, UK-domiciled undergraduate students, academic year 2020/21. AAA+ pool includes equivalent Scottish qualifications. See note on HESA data for full citation.
Mixed Heritage students
- The number of UK-domiciled Mixed Heritage applicants to Oxford has risen since 2018, as have the numbers of students receiving offers and being admitted.
- The proportion of UK-domiciled students admitted to Oxford who indicate in their UCAS application that they identify as Mixed Heritage rose from 6.5% in 2018 to 8.8% in 2022.
UK-domiciled Mixed Heritage students: applications to Oxford, offers made and students admitted, 2018–2022
| Applications | Offers | Admitted | Proportion of total UK students admitted11 | |
2022 | 1,186 | 242 | 223 | 8.8% |
2021 | 1,126 | 223 | 217 | 8.2% |
2020 | 1,053 | 262 | 256 | 8.8% |
2019 | 969 | 247 | 206 | 8.1% |
2018 | 816 | 191 | 162 | 6.5% |
11. Excluding students whose ethnicity status is not declared.
*Most recent available national data covers 2020 intake: defined as first-year, first-degree, UK-domiciled undergraduate students, academic year 2020/21. AAA+ pool includes equivalent Scottish qualifications. See note on HESA data for full citation.
**National data does not include Mixed ethnicity as a separate category; it only provides ‘other including Mixed’ where ‘other’ includes all ethnicities that do not fall into any subcategories of White, Asian or Black ethnic groups.
For further information on all Oxford's admissions statistics, including by course and by college, please read the Annual Admissions Statistical Report.
You may also be interested to see detailed statistics relating to ethnicity.